 In the 80s and 90s, electricity usage in the United States grew at roughly 2.5% per year. As fears of a Y2K computer crash subsided, the seeds of a new concern for electric utilities were planted. From 2000 to 2007, total electricity usage grew by 1.5% per year, a growth rate nearly half of what it had been for two decades. And then the Great Recession hit all sectors of the economy. Since that time, total electricity consumption growth has completely stalled out. In fact, commercial and industrial sector sales in the U.S. have seen little to no recent growth compared to pre-recession periods. The industrial sector has yet to return to its 2007 usage level.
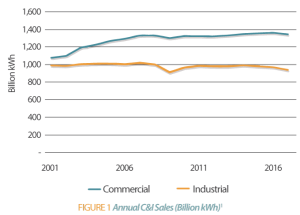
American energy usage today is drastically different than it was twenty and thirty years ago, raising the question of whether this shift is structural and therefore permanent or more transitive in nature. GDS dove into the major factors behind changes in residential consumption in the Jul/Aug 2017 Transactions article, concluding low energy sales growth in that sector will likely remain into the future. This article explores the factors behind changes in commercial and industrial (C&I) consumption patterns.
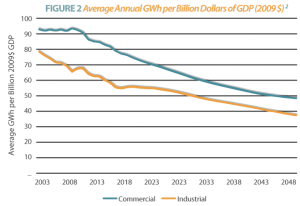
While average residential electricity consumption per household has remained flat, C&I average use, measured here as consumption per dollar of GDP, is projected to decrease over 30% by 2050, as seen in Figure 2. Residential usage is heavily influenced by technological advances, economics, and changes in household structure and consumer awareness. While technological advances and the economy drive consumption in the residential sector, their impact is much more dramatic on the C&I sector. There are four main factors driving reductions in commercial and industrial consumption: the economy, increased manufacturing and workforce efficiency, energy efficiency and lighting programs, and distributed generation.
What is driving evolving consumption patterns?
Economics
The 2008 Great Recession, coupled with a general movement of the U.S. economy to a service economy, has resulted in plummeting manufacturing and production output in the US. Electricity usage in the C&I sector is strongly tied to the U.S.’s Gross Domestic Product (GDP). GDP declined by 1.5% per year from 2007 to 2009 while electricity sales to C&I customers decreased by 3% per year. This results in a 1.5% decrease per year in average use, measured as kWh per GDP, from 2007 to 2009. While the economy began to recover and the American manufacturing industry resumed growth, the 2008 recession left a lasting mark on industrial electricity consumption. According to the U.S. Energy Information Administration (EIA), manufacturing fuel consumption increased by 4.7% while real gross output increased by 9.6%. This resulted in a 4.4% decrease in average use. Most of this decrease is attributable to the shift of manufacturing output from energy-intensive industries, such as metal, chemical, paper, and coal product manufacturing, to non-energy-intensive industries, such as transportation, machinery, and plastic product manufacturing. The EIA’s Manufacturing Energy and Consumption Survey (MECS) indicates that had each manufacturing industry maintained its same share of the market from 2010 to 2014, the average use decline would have been 0.7% instead of 4.4%. As the U.S. shifts to a less energy-intensive manufacturing market and switches to a country with more service based industries, declining average use is expected to continue.
In the commercial sector, warehousing and office buildings replaced service and mercantile facilities as the most common building type. These facilities are consuming more square footage in the U.S. than more energy-intensive buildings, such as food service facilities and hospitals, and represent over 50% of the total commercial floorspace. In addition, vacancies in commercial buildings increased from around 190,000 to 300,000 between 2003 and 2012.
One positive for electric utilities of the economic migration from manufacturing to service industries is the rise of the digitization of nearly everything and the accompanying Big Data revolution. Data is being generated in all areas of our lives through watches, RFID tags, social media platforms, and thermostats. Companies continue to be interested in storing and accessing that data in safe and secure data warehouses. Such facilities use considerable electricity and at an extremely high load factor. Continued growth in data warehousing needs for the U.S. economy should help offset declining energy sales in certain service territories.
Increased Manufacturing and Workforce Efficiency
In the years following the recession, manufacturing output has risen while employment has decreased. This indicates increased labor productivity, primarily due to incorporation of advanced, robotic technologies and automation. Processes that were previously labor intensive and required high electrical loads over extended periods of time can now be condensed or scheduled to optimize electricity usage. In addition, manufacturing equipment across all industries has become more efficient and requires less energy input to produce the same amount of output in less amount of time.
Energy Efficiency and Lighting Programs
According to the EIA’s Commercial Buildings Energy Consumption Survey (CBECS), energy usage by space heating and lighting appliances are down 11% from 2003 to 2012. These reductions can be attributed to higher performance standards, stricter building codes, and increased new construction in more temperate climates. Nearly all commercial end-uses’ electricity consumption per square foot of floorspace are projected to decline. Large decreases are expected among heating, cooling, ventilation, and lighting end uses.
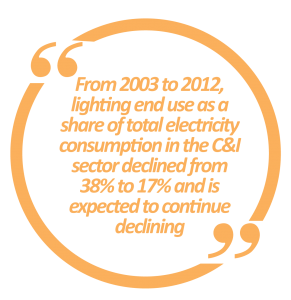
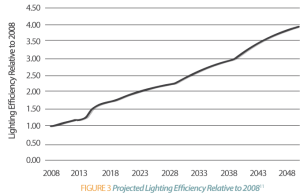
From 2003 to 2012, lighting end use as a share of total electricity consumption in the C&I sector declined from 38% to 17% and is expected to decline. Two policies, passed between 2003 and 2012, have affected lighting efficiency. The Energy Policy Act of 2005 (EPAct) increased performance standards on commercial lighting and created a temporary tax credit for energy efficient buildings. The Energy Independence and Security Act of 2007 (EISA) increased efficiency standards minimums for bulb types, requiring 25% more efficiency by 2012. Incandescent bulb saturation fell by 5% in this period as a result of not meeting EISA standards. Additional efficiency is required by 2020 and is expected to set a threshold that neither incandescent nor halogen bulbs can meet. LED bulbs were surveyed for the first time in the 2012 CBECS and showed 3% of floorspace to be lit by LED bulbs. Since 2012, LED installations in the commercial and industrial sector have continued to increase. As outdated incandescent and fluorescent bulbs begin to fail, LED bulb installation will continue to increase and remain in place as their life span at least doubles the life span of other bulbs. In addition to the impacts of these government standards on lighting consumption, energy efficiency programs continue to incentivize C&I customers to install efficient lighting. Lighting bulb efficiency is expected to quadruple by 2050 as shown in Figure 3. Occupancy sensors and lighting scheduling are used in 16% of commercial buildings and 43% of large buildings which further reduce lighting electricity usage.
While lighting is the most rapidly decreasing electric end use, HVAC is also seeing dramatic changes in electricity consumption in the C&I sector, mostly due to energy efficiency programs, improvement in device efficiency, and more stringent building codes. In the 2014 MECS, 48% of the surveyed manufacturing facilities indicated participation in energy efficiency programs. EISA also requires stricter standards on refrigeration and furnace fan loads. From 2003 to 2012, government buildings’ average energy consumption per square foot declined by 23%. Government buildings represent approximately 14% of commercial buildings and are subject to stricter efficiency standards, as established in the 2015 Executive Order that required all federal buildings to reduce their energy intensity by 2.5% annually until 2025. Building Automation Systems (BAS) that control lighting and HVAC are 3 times more common in government buildings than in non-government buildings.
Distributed Generation
Distributed generation has increased rapidly in the past few years, particularly in 2016. The manufacturing sector generated 110,000 GWh, approximately 10% of all industrial sector electricity produced. This generation was primarily generated by the most energy-intensive manufacturing facilities using combined heat and power technology. Solar generating capacity increased by 50% from 2015 to 2016, partially due to expiring federal tax credits encouraging a late surge of installations. Community solar projects for the commercial sector are rapidly expanding, particularly in California, Minnesota, and Massachusetts, having quadrupled installations in 2016 alone. Solar generation in only expected to increase as installation costs continue to decline, with around 4 GW of generating capacity in the commercial and industrial sector expected to be in place by 2022. Although the recent Trump administration tariffs placed on imported solar panels will temporarily increase the cost of solar, many experts think the effect will be temporary and the cost will continue to decline in the long term.
Conclusion
Commercial and industrial sector energy intensity is expected to continue to decline over the long term, as seen in Figure 2. These declines can be attributed to lasting economic shifts from the 2008 recession, increasing manufacturing, lighting, and energy efficiency, and the increasing saturation of distributed generation. These are structural changes in the way the C&I sector consumes electricity and will therefore have a lasting effect. A growing economy in which employment increases, data warehousing grows, and business thrives will be the likely engine necessary to drive national overall electricity sales to the C&I sector in the next ten to twenty years.
For more information or to comment on this article, please contact:
 John Hutts, Principal | CONTACT
GDS Associates, Inc. – Marietta, GA
770.425.8100
Download PDF
Also in this issue: Utilities Need a Seat in the Unified Command…Not Just IMTs