Natural Gas Trends
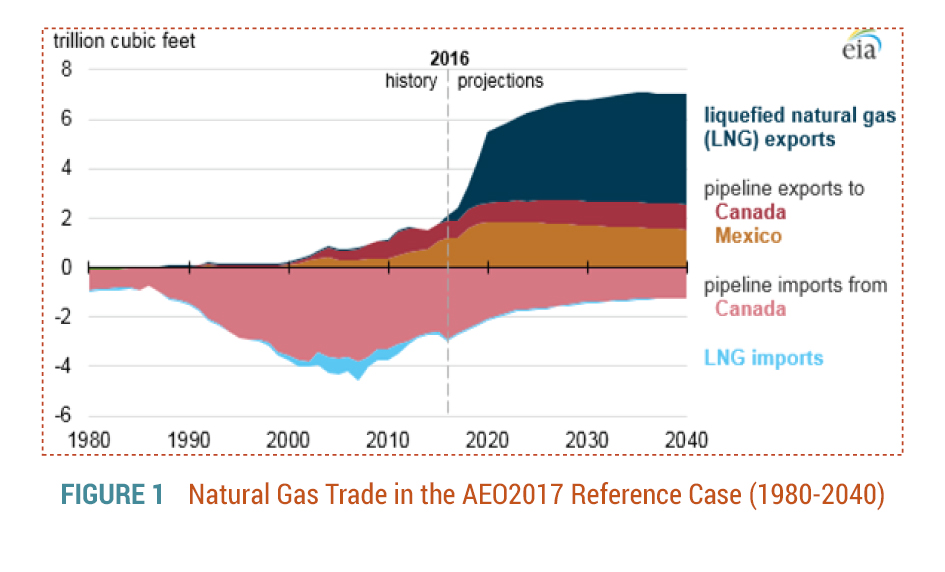
 In a 2015 GDS TransActions article, it was noted the U.S. was transitioning from being a modest importer of natural gas to becoming a significant exporter. The driver behind this trend was expected to be shale gas supported liquefied natural gas (LNG) exports. As recently reported by FuelFix, an energy business reporting arm of the Houston Chronicle, the U.S. is on track to become a net exporter of gas next year primarily because of LNG exports. This will help to establish the U.S. as one of the global LNG hubs, as seen in Figure 1. Exports of gas are also being driven by U.S. pipelines transporting gas to Mexico for power generation. And as previously mentioned in TransActions, the export trend in the gas market is merging with other gas market trends setting up the potential of creating more shale shock discontinuities in the flow of gas, in the price of the commodity, and in the energy marketplace. Exxon announced recently a proposed $10 billion petrochemical facility to be built near Corpus Christi, Texas. The Wall Street Journal (WSJ) reported that the West Texas Permian Basin is emerging as another major source of new natural gas that could rival the output of the Appalachian Marcellus Shale, the biggest gas producing region in the nation. The WSJ notes this new shale gas could pressure gas prices for years. Kinder Morgan is planning the Gulf Coast Express Pipeline to move Permian gas to the Texas Gulf Coast. A BP senior executive speaking at a recent conference noted that the state of the industry and the shale gas revolution is turning the industry on its head, causing it to deal with an extraordinary amount of simultaneous change, arguably the fastest and most significant energy transformation during his career.
![]()
Energy Market Trends
 The potential of discontinuities and the impact they may have on energy stakeholders is not limited to the gas market. These potential discontinuities>exist across the future state of the energy sector. For example, being a net exporter of energy is not going to be limited to gas. The DOE states that the U.S. is projected to become a net exporter of total energy products in the coming years. FuelFix notes that this was virtually an unheard of proposition just a decade ago. DOE expects total energy production in the U.S. to steadily increase. With energy consumption in the U.S. not expected to change much, capital investment is going to new energy infrastructure being developed to support the export of energy elsewhere. U.S. presidents have promoted the idea of American “energy independence” for decades. However, in a very recent news conference, President Trump has scrapped that line in favor of what he calls ”energy dominance.” In Trump’s vision, the U.S. should become a net exporter of energy and use those resources as a vehicle for economic growth. His plan for “energy dominance” also means using the country’s resource — particularly LNG — as a bargaining chip in the international arena to provide energy security to allies.
Although electric power remains the largest consumer of primary energy in the U.S., it too has its trends. According to the DOE, the growth in electricity demand has slowed, partially due to efficiency standards being implemented and technology change occurring. Demographic and economic factors helping to drive this trend include changes in population growth, housing, and an economy that has shifted toward less energy intensive industries. In addition to slowing growth, energy intensity in the U.S. – the amount of energy used per unit of economic growth – has been on a declining trend. And this trend is projected to continue as the energy efficiency and structural changes in the economy tend to work to lower energy intensity going forward. DOE expects this trend to continue to the point where its energy intensity index will be only a third of what it once was.
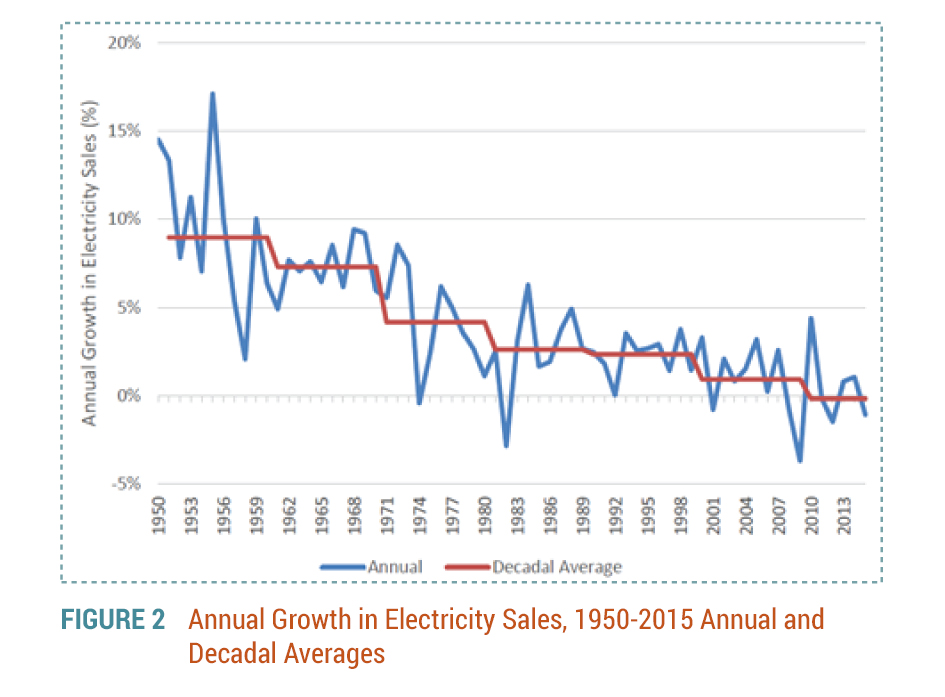
As seen in Figure 2, the electricity growth rate, which hit double digits in the 1950’s, has generally seen flat to negative growth in recent years. DOE projects the electric growth rate trend to be around one percent or so for an extended period of years.
 In a recent report by UtilityDIVE, it notes that the growing complexity of the power sector and a rapid influx of renewables, distributed generation, and DSM are combining to create new concerns for electric utilities, while long-standing issues remain unsolved, suggesting a clash of new and old trends. And these concerns aren’t limited to utilities. Earlier this year, an IPP executive told analysts on a conference call that the independent power producer model is now obsolete and unable to create value over the long term. The IPP is selling its renewables portfolio and other IPPs may look to sell all of their generating assets.
![]()
Counter Trends
At the same time DOE’s electric power outlook nationally is going one way; others see their regional trends going another way. ERCOT, for example, in its Long Term System Assessment report, sees load growth continuing for its region. In fact, ERCOT sees this happening in most of its assessment scenarios. Also, ERCOT sees its gas price at around $3.75 per MMBtu for 2017 and increasing steadily thereafter. Only one scenario shows flatter prices.
Currently, NYMEX shows Henry Hub prices rising above $3 per MMBtu as we head to year’s end but dropping back down below $3 much of next year. ERCOT notes the doubling of the going forward market heat rates in a couple of its assessment scenarios.
DOE expects this trend to continue to the point where its energy intensity index will be only a third of what it once was.
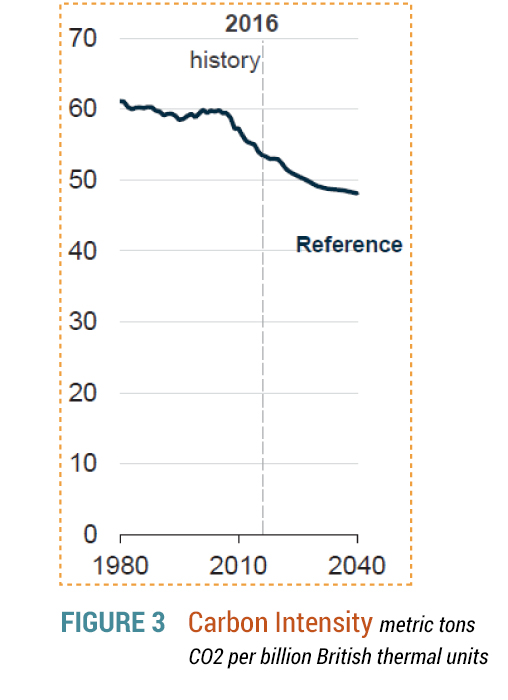
Speaking of declining, like energy intensity, carbon intensity has also declined according to the DOE (as seen in Figure 3). This decline has steepened in recent years and DOE expects this trend to continue. And with a change in the White House Administration and the decision to back out of the Paris agreement, what was a growing trend in carbon initiatives and renewables may end up becoming a discontinuity. Speaking at the recent CERA conference in Houston, the president of the American Petroleum Institute stated that it would be very difficult to pass a Federal carbon tax in the current political construct. SNL reports that because the new administration has shown less interest in the renewable industry, wind and solar companies are now refocusing on the opportunities at state capitols to help drive their industries. But according to Advanced Energy Economy, a business group that advocates for clean energy, what goes on at the federal level seeps out into the states. And although the PTCs and ITCs are set to decline, as we’ve seen before, Washington can change these trends.
![]()
And So…
 Granted, we touched on just a few of the more visible examples of trends out there but there are lots of others at the national, state, and local levels. Will the changing and sometimes conflicting trends filter down and have a quick and direct impact on utility stakeholders, their market landscapes, and the decisions they make? Some may and some may not and some of those that may will take time to seep in. On the power spending side, according to the DOE, even if the CPP is not implemented, low natural gas prices and the tax credits result in natural gas and renewables as the primary sources of new generation capacity. DOE notes that the future generation mix is sensitive to the price of natural gas and the growth in electricity demand. A lot of the new gas based generation is expected in the Marcellus shale region. This region also has high concentration of coal plant retirements and high cost base load generation resources causing state lawmakers to try to buoy up some of these units through subsidies. PJM, which operates in this region, is undertaking a process aimed at integrating state power policies into their marketplace.
![]()
What to Do
New trends can emerge, current trends can change subtly or abruptly, going in different directions than what was originally anticipated when key decisions were made. These changing and emerging trends add to the challenge of navigating the landscape of energy and utility markets. With every day, every month, and every year, decisions need to be made, analyses are performed, models are run, and meetings are held. Whether it’s strategic or tactical, short-term or long-term, expense or capital assets, build or buy, rate changes or not, the options are numerous and the consequences can be material and long lasting. Decision makers for the sake of their stakeholders strive to make the best decisions they can. To navigate through these challenges, decision makers should:
- Fully understand the landscape of their markets
- Assess potential emerging changes to this landscape
- Incorporate this landscape into the going forward analysis
- Know the limitations of the analysis and its modeling
- Value the risks associated with a range of outcomes
- Position decisions to effectively manage these risks
Despite all the trends, some conflicting, some changing, decision makers can proactively follow the guidelines mentioned above to successfully manage their decision analysis. GDS has been fortunate to assist various clients with working through projects ranging from unique one-off commercial transactions to comprehensive long term system planning efforts. We can help you successfully navigate through these decision processes.
For more information or to comment on this article, please contact:
 Paul Wielgus, Managing Director | CONTACT
GDS Associates, Inc. – Marietta, GA
770.425.8100
DOWNLOAD PDF
Also in this issue: The Electricity Use Flatline