- Home
- Services
- Hi-Line Engineering
- About
- Careers
- Contact
- Requests For Proposals
TransActions - February/March 2015 Newsletter Edition By GDS Associates
by GDS Associates, Inc | February 1, 2015 | Newsletter - TransActions
- The Sun Will Come Out For Utility Scale Solar Projects
- Follow the Yellow Brick Road to Energy Efficiency and Demand Response Programs | VIEW
The Sun Will Come Out For Utility Scale Solar Projects
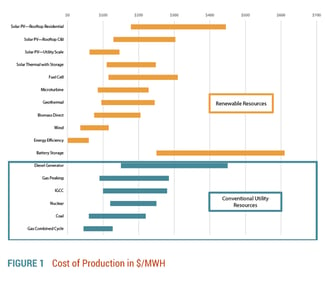
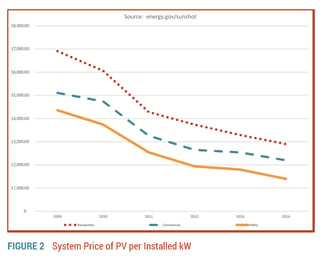
Many of us working in the electric industry can remember the days where the tinkerers would add solar to their roof tops to save on their power bills. We roll our eyes and scoff that the pay back is forever, even with tax incentives. Well, times have changed because utility scaled solar projects (500 kW – 10 MW) are now at a low enough cost that the energy generated will be less than the typical retail cost of energy. At $4,500 per kW, solar generation was once an extremely high cost asset, but now, electric utilities are executing engineering procurement and construction (EPC) contracts for less than $1,200 per kW (excluding any tax incentives) which translates into about 6.5 cents per kWh. At $1,200 per kW, the utility owned-solar is very viable in today’s market place. Experts expect for installation cost to continue to trend favorably, because installed solar costs in Germany have bottomed out at $900 per kW and German installers use the same solar panels as the US installers. Figure 1 shows that utility scale solar is becoming the next low cost option for energy.

In Georgia, a major change in the industry occurred when Georgia Power was recently compelled by the Georgia Public Service Commission to procure 500 MW of solar resources. Then, late in 2014, a group of electric cooperatives in Georgia contracted for 130 MW of solar power. This buying spree created competition in the solar market which has driven down costs partly by reducing margins in the solar plants – this is known as commoditizing the solar assets. The commoditized prices provide leverage for electric utilities across the country to own solar assets rather than rely on a developer to own and operate the asset.
Tax incentives for solar resources influenced a market model where developers built and owned the solar assets. Public power cannot directly take advantage of those tax incentives and thus have been looking at developers to provide the resource. The falling cost of the components to build solar plants and future expiration of tax incentives are changing the market. Furthermore, many jurisdictions are requiring electric coops or PUDs to acquire some percentage of their power from renewable resources. Electric utilities should be thinking of potential benefits of direct ownership of solar resources. Solar has become particularly compelling for public power because they have access to low cost capital and a connection to their members for personal investment in the power production.
Utility ownership of the solar asset adheres to the public power principals of providing low cost power because margins for the asset are retained to benefit the members/public, rather than the developer. Another reason this is possible is because the risk of owning and operating solar is greatly reduced. The technology advances coupled with warranties offered by manufacturers result in a more robust asset that requires minimal maintenance; such as cleaning panels, mowing vegetation, and maintaining the inverters and SCADA connections. All of the skills necessary for this maintenance are inherent in most utilities.
For utility scaled projects, there are essentially two sizes: Transmission scale (over 20 MW) and Distribution scale (less than 10 MW).

Over 20 MW in size will generally require a dedicated substation to interconnect the generation resource to the electric grid. Less than 10 MW, the solar site can be interconnected to a distribution feeder. On the lower end of the distribution scale, a 1 MW plant could be installed 3 to 5 miles from the substation and interconnected using a standard line recloser. Further out on the feeder, the solar plant will help reduce line losses, and provide var support as well as voltage support. In fact, the placement of distribution scale solar plant is very analogous to the placement of a switched capacitor bank.
The modular nature of solar plants less than 10 MW in size still provides the economy of scale normally thought to exist with large power production resources. Said another way, a 1 MW plant will cost only modestly more than a 10 MW plant in terms of capital investment per kW of actual solar equipment installed, but could in some cases reduce the required investment in support infrastructure (substation & transmission) and land cost, which could result in an overall lower cost/kW for solar in the aggregate. Thus, it is possible to think in terms of multiple 1 MW to 3 MW solar plants scattered within a distribution system rather than a single large resource. Each 1MW of solar capacity requires about 8 to 10 acres to accommodate the solar panels. So, small scale projects require less contiguous land.
In the future, especially in light of the current movement towards localized distributed generation, distribution scale solar plants will look and feel more like standard distribution plant-like capacitors, SCADA, and AMI facilities. The solar assets will support the distribution system and will be maintained just like any other asset on the system. This is in contrast to a customer-owned solar asset which is not controlled by the utility and must strictly adhere to interconnection standards. As a utility owned resource, the utility can control output functions including var support and lock-out of the resource during line maintenance. Further, many jurisdictional authorities have saturation standards for distributed generation. Meaning, there is a limit to the total aggregate of distributed generation that can be installed on a feeder which is typically 5% to 20% of the feeder’s annual peak demand. These saturation limits are a limitation for system stability, for example, Hawaii has a moratorium for new residential solar due to high saturation levels. Similar problems are occurring in Germany. Utility owned distributed generation will qualify for the aggregate total thus potentially limiting the capacity available to other owners of distributed generation.
Through utility ownership with potential subscription of the solar asset to customers, the utility has a means to control or at least influence the erosion of the fix cost recovery while also offering a lower cost alternative to retail customers who really want to “own” solar or have their energy consumption sourced from a renewable resource. This could curb the amount of distributed generation connected to the grid through net metering agreements with individual retail customers.
GDS can provide assistance with all aspects of developing utility scale solar plants excluding physical construction. As such, GDS can serve as an unbiased ally when considering how to effectively employ solar for an electric utility.
Electric utilities have a number of factors to consider when deciding whether or not to invest in utility scale solar assets; from general concept evaluation, to placement of the resource, design, construction management, and everything in between. During this process it is helpful to conduct portfolio analysis of solar resources and risk analysis of new assets/contractors, evaluate transmission access and congestion issues which are critical for transmission scale projects, and manage the integration requirements, including determining cost effective placement of a solar asset, permitting the site, procurement support, design services, construction management and development of maintenance plans. GDS as an engineering and consulting firm can provide assistance with all aspects of developing utility scale solar plants excluding physical construction. As such, GDS can serve as an unbiased ally when considering how to effectively employ solar for an electric utility.For more information or to comment on this article, please contact:
 Kevin Mara, Principal | CONTACT
GDS Associates, Inc. – Marietta, GA
770.799.2381
Follow the Yellow Brick Road to Energy Efficiency and Demand Response Programs
 Many electric cooperative, municipal utility and government clients offer a range of energy efficiency (EE) and demand response (DR) programs to their customers (called “members” in the electric cooperative world). These entities cite many reasons for offering such programs to customers but the most touted benefits of EE & DR programs are:
-
- Many EE&DR programs are much less expensive than the capital and operating costs of new generation facilities
- Offer a way to save energy and money
- Reducing energy use can help address climate change issues
- Can help postpone the need for new power plants and transmission and distribution facilities
- Can reduce emissions of CO2, SO2, NOX and particulates from power plants
- Can help diversify a utility’s resource mix and reduce reliance on fossil fuels
- Can help comply with applicable government laws and regulations (e.g., energy efficiency portfolio standards, integrated resource planning requirements, US EPA rules, etc.)
- Can help address high bill complaints of utility customers
As 2015 begins, many electric utilities seeking guidance relating to best practices for the design, implementation and evaluation of EE & DR programs. This article presents a snapshot of the latest information on such EE & DR best practices and provides citations to best practices studies developed by the National Action Plan for Energy Efficiency.
Program Planning and Program Design
 You have likely heard that “it doesn’t matter what road you take if you don’t know where you want to go.” The first step for EE & DR planning is to develop a sound business case for implementing such programs. The business case should define the reasons that your organization is pursuing EE & DR. Developing this business case includes reviewing a comprehensive list of EE & DR benefits and costs and making a decision if your utility or organization finds that such programs are cost effective, can help comply with laws and regulations, or meet customer needs and preferences. The second step is to conduct an energy efficiency/demand response potential study to identify the EE & DR options that can save the most energy and are the most cost effective.
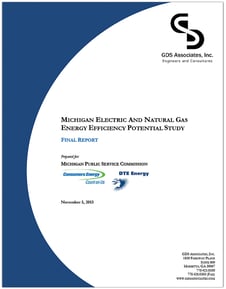
The results of such a study can help your organization set priorities for program design and implementation, since most organizations do not have unlimited budgets for EE & RD. An excellent guide for conducting such EE/DR potential studies is the November 2007 National Action Plan for Energy Efficiency “Guide for Conducting Energy Efficiency Potential Studies.”1 The results of the potential study provides the roadmap that an organization needs to design and implement cost effective programs that will achieve meaningful energy savings. A recent example of a completed energy efficiency and demand response potential study is the November 2013 potential study for the State of Michigan.2 This study is available at: https://www.dleg.state.mi.us/mpsc/electric/workgroups/mi_ee_potential_studyw_appendices.pdf
EE/DR Potential Studies can help your organization set priorities for program design and implementation, since most organizations do not have unlimited budgets for EE & DR.
Program Implementation
Utilities and government agencies in the US and Canada have been implementing effective EE & DR programs for decades. The first step with program implementation is to develop a detailed program plan. The program plan should include the following information:
-
- The goals and objectives of the program
- Target market (e.g., residential single-family, residential multi-family, commercial, industrial, agricultural, other, etc.)
- Eligible energy efficiency measures
- Eligible participants
- Marketing methods
- Education and outreach methods
- Staffing plan
- Financial incentives for participants and/or contractors
- Energy efficiency/demand response potential kWh/kW savings
- Cost effectiveness analysis
- Evaluation plan
The program plan should include an assessment of the 1) remaining energy savings potential for the program and 2) program cost effectiveness. Generally, programs should be designed so that they have a benefit/cost ratio greater than 1.0. There are often additional criteria to consider, such as making sure that there are programs for all customer classes (i.e., residential, commercial, industrial, other) and for low-income and hard-to-reach customers, that programs have continuity, and that programs provide for energy efficiency education. There may also be other utility, regional, or policy factors to consider in developing the energy efficiency program.3 It is often helpful to examine existing program plans that are available in filings made by utilities with state regulatory commissions. For example, one can find the most recent program plans developed by all seven investor-owned electric utilities in Pennsylvania on the web site of the Pennsylvania Public Utility Commission.4
Program Evaluation
Evaluation of EE & DR programs has two key objectives:
- To document and measure the effects of a program and determine whether it met its goals with respect to being a reliable energy resource.
- To help understand why those effects occurred and identify ways to improve current programs and select future programs.
Energy efficiency impact evaluations are conducted to determine actual energy savings (versus predicted estimates) attributable to an energy efficiency or demand response program or measure. Process evaluations assess how efficiently a program was or is being implemented, with respect to its stated objectives and potential for future improvement. All energy efficiency program categories can be assessed using process evaluations. Findings and recommendations from regular impact and process evaluations can be used to continuously improve programs to make them more efficient and cost effective. In addition, evaluations often include cost-effectiveness analyses that document the relationship between the value of program results (i.e., energy, demand, and emission savings) and the costs incurred to achieve those benefits.5
Emerging Technologies
Every day we learn about emerging EE & DR technologies that will help us use energy more efficiently. Here are three examples of emerging technologies that will change our energy consumption patterns in the future:
-
- Smart appliances now exist that can either shift their time of operation or curtail their operation temporarily upon request from an electric utility. This reduction in power use can lead to power grid benefits manifested as savings in wholesale power production costs.
- Lawrence Berkeley National Laboratory is conducting a project to develop a cost-effective, high-performance residential window that maximizes net useful solar gain in heating mode and minimizes solar gain in cooling mode. Fully automated operation that optimizes energy savings is provided by an intelligent, networkable sensor/microprocessor package that is easily installed and calibrated. Control algorithms are being developed for this high technology window that focuses on maximum energy savings while keeping occupants experience in mind.
- Oak Ridge National Laboratory is developing a carbon dioxide (CO2) heat pump water heater (HPWH) that meets ENERGY STAR® standards for HPWHs at an installed cost that will enable widespread acceptance in the U.S. residential market. CO2 has low global warming potential when compared to other refrigerants, has zero ozone depletion potential, is very inexpensive, and is not flammable.
Funding of EE & DR Programs is Increasing
Due to increasing concerns about climate change, national energy security and volatility in fossil fuel prices, electric and natural gas utilities and government agencies in the US and Canada are increasing commitments to energy efficiency and demand response programs to meet the energy needs of residential, commercial and industrial consumers. The Consortium for Energy Efficiency reports that US and Canadian combined gas and electric Demand-Side Management (DSM) program budgets reached $9.6 billion in 2013, representing a 2% increase over 2012 DSM budgets. US and Canadian combined gas and electric DSM program expenditures reached $8.0 billion in 2012, representing a 9% increase over 2011 expenditures. If you are a decision-maker in a utility or government agency that is interested in expanding the EE & DR offerings of your organization, the best practices and methods outlined in this article provide guidance on where to find the data, analytical techniques and case studies to jump-start your energy efficiency and demand response initiatives.
Sources
- See https://www.epa.gov/cleanenergy/documents/suca/potential_guide.pdf
- See https://www.dleg.state.mi.us/mpsc/electric/workgroups/mi_ee_potential_studyw_appendices.pdf
- See Chapter 6, Energy Efficiency Best Practices, in the NAPEE guide titled “National Action Plan for Energy Efficiency”, July 2006. Available at https://www.epa.gov/cleanenergy/documents/suca/resource_planning.pdf
- See https://www.puc.pa.gov/filing_resources/issues_laws_regulations/act_129_information/
energy_efficiency_and_conservation_ee_c_program.aspx - For a thorough discussion of evaluation concepts and methods, see the national Action Plan for Energy Efficiency guide titled “Model Energy Efficiency Program Impact Evaluation Guide”, November 2007. Available at https://www.epa.gov/cleanenergy/documents/suca/evaluation_guide.pdf
For more information or to comment on this article, contact:
 Richard Spellman, PresidentCONTACT
GDS Associates, Inc. – Marietta, GA
770.425.8100
GET OUR NEWSLETTER
RECENT POSTS
- Why MOD-026-2 Matters: Raising the Bar for Generator and IBR Modeling Reliability
- Exploring the 2026-2028 Reliability Standards Development Plan
- Blackstart Resource Availability During Extreme Cold Weather Conditions
- DOE Pushes FERC to Accelerate Large Load Grid Access
- Building a Cyber-Aware Workforce in the Utility Sector
Archives
- December 2015 (8)
- June 2025 (7)
- January 2016 (6)
- July 2016 (6)
- March 2021 (6)
- May 2022 (6)
- August 2020 (5)
- March 2015 (4)
- January 2019 (4)
- June 2019 (4)
- August 2019 (4)
- February 2020 (4)
- May 2020 (4)
- June 2020 (4)
- December 2020 (4)
- July 2021 (4)
- October 2021 (4)
- April 2024 (4)
- December 2024 (4)
- May 2025 (4)
- April 2015 (3)
- August 2016 (3)
- February 2017 (3)
- July 2017 (3)
- February 2018 (3)
- February 2019 (3)
- November 2019 (3)
- March 2020 (3)
- April 2020 (3)
- September 2021 (3)
- December 2021 (3)
- August 2022 (3)
- December 2022 (3)
- April 2023 (3)
- July 2023 (3)
- December 2023 (3)
- September 2024 (3)
- October 2025 (3)
- December 2025 (3)
- May 2014 (2)
- February 2016 (2)
- March 2016 (2)
- September 2016 (2)
- November 2016 (2)
- January 2017 (2)
- July 2018 (2)
- November 2018 (2)
- March 2019 (2)
- May 2019 (2)
- July 2020 (2)
- September 2020 (2)
- April 2021 (2)
- August 2021 (2)
- October 2024 (2)
- September 2025 (2)
- February 2014 (1)
- April 2014 (1)
- July 2014 (1)
- August 2014 (1)
- November 2014 (1)
- February 2015 (1)
- May 2015 (1)
- June 2015 (1)
- November 2015 (1)
- October 2016 (1)
- December 2016 (1)
- October 2018 (1)
- December 2018 (1)
- April 2019 (1)
- July 2019 (1)
- September 2019 (1)
- October 2020 (1)
- November 2020 (1)
- February 2021 (1)
- April 2022 (1)
- July 2022 (1)
- October 2022 (1)
- August 2023 (1)
- October 2023 (1)
- July 2025 (1)
- November 2025 (1)
Categories
- Newsletter - TransActions (85)
- News (78)
- Employee Spotlight (35)
- Energy Use & Efficiency (28)
- Energy, Reliability, and Security (17)
- Other Specialized Services (11)
- Environment & Safety (10)
- Power Supply (8)
- Transmission (8)
- NERC (7)
- Utility Rates (7)
- Cyber Security (5)
- Energy Supply (4)
- Hi-Line: Utility Distribution Services (4)
- Battery Energy Storage (3)
- Uncategorized (2)
- Agriculture (1)
- Hi-Line: Seminars & Testing (1)
