Utility Betas: A Review of the Continued Impact on Estimates Resulting from the COVID-19-Related Market Volatility
If you are active in regulatory cost of capital proceedings for utilities, you likely will have noticed that the CAPM method has been producing cost of equity estimates that are now considerably greater than before the COVID-19-related market volatility experienced in early 2020. One reason for this increase, is the sharp rise seen with the “beta” estimate for utilities with the estimate having moved closer to parity with the market. The “beta” term measures the volatility of a company’s stock return relative to the market return. The price of a stock that has a beta value greater than 1.0 is assumed to be more responsive to a change in the market returns than a stock that has a beta value of less than 1.0. Therefore, it is surprising that in times of extreme market volatility, that utilities, a sector considered by many to be a defensive investment,[1] experienced a significant uptick in alignment with the broader stock market. In this article, we focus our review on assessing how betas for utilities have evolved since early 2020 with the aim of providing insight as to why the CAPM method is now producing higher cost of equity estimates for utilities and to assess whether there are indications that betas will revert back to pre-COVID-19 pandemic levels.
1. Foundation - Measuring Beta
The mathematical formula to calculate a beta estimate for an individual stock is well-established, and typically relies on historical realized return data. However, analysts, academics, commercial providers of financial information and investors rely on different inputs to apply the formula and this results in quite different estimated betas being produced.[2] For the purposes of this article, we use a computational approach accepted by FERC, where the beta for an individual stock is measured using the S&P 500 as the market return index over a 5-year period based on weekly realized return data and is Blume-adjusted. We also use the S&P 500 Utility sector as a proxy for individual utility stocks. For reference, the beta can be determined using the following expression:[3]
β = Correlation (Ri, Rm) x σi / σm
Where, β = beta, Ri = the return on the individual stock, Rm = the return on the market, σi = standard deviation of the return on the individual stock, and σm = the standard deviation of the return on the market.
2. Impact of COVID-19 Market Volatility on Utility Betas
Following the COVID-19-related market volatility experienced in early 2020, the 5-year betas for utilities increased dramatically in a matter of a short few weeks from 0.55 to around 0.85-0.90, an increase of approximately 0.30-0.35. This is quite a remarkable turn of events considering utilities are considered a defensive investment, the betas utilize 5-years of weekly data and that they were generally trending downwards towards 0.55 for several years. Of course, early 2020 involved some quite extraordinary times. Figure 1 below illustrates rolling 5-year betas for the S&P 500 Utility sector using market data since 2000.[4]
Figure 1: S&P 500 Utility Sector 5-Yr. Betas
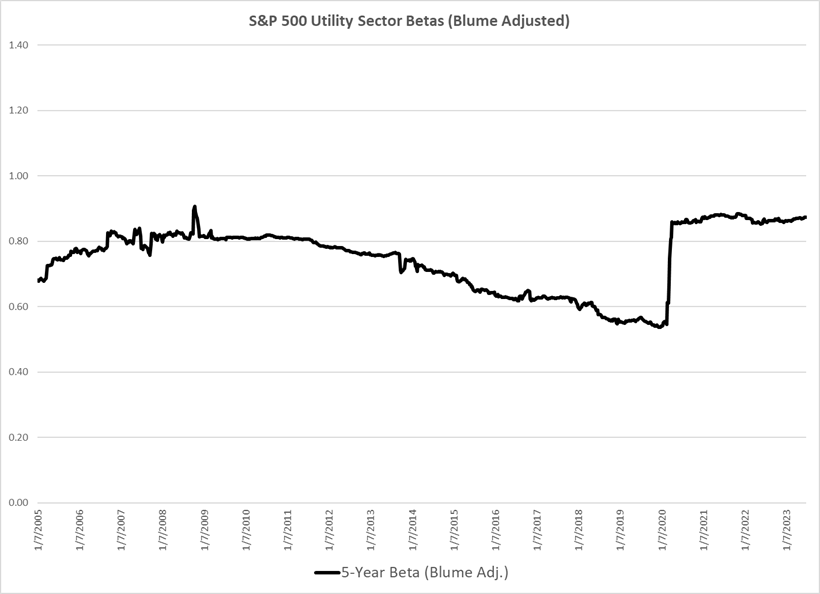
Source: market data retrieved from S&P Capital IQ
The current level of utility betas stands in contrast to how utility betas have evolved over the last two decades. In Figure 1, it can be seen that 5-year utility betas have not been above 0.80 since the Fall of 2011. Since that time, utility betas had steadily declined to 0.55. It can also be seen that while utilities betas previously spiked to 0.90 in October 2008, a period where the Dow Jones Industrial Average fell by 22% over eight trading days[5], the 5-year beta estimate quickly reverted back to around the 0.80 level by the end of November 2008. In the period since early 2020 through June 2023, utility 5-year betas continue to remain at the higher 0.85-0.90 level and have not subsequently declined.
3. How Will More Recent Stock Market Dynamics Impact 5-year Utility Betas?
There are indications that the relationship between utility stocks and the wider S&P 500 index continues to evolve in a manner that is once again putting downward pressure on utility beta values.[6] One way of assessing how more recent market data may impact forthcoming 5-year beta values is to measure betas using a shorter study period of 1 or 2 years.[7] Figure 2 below shows rolling utility betas measured using 1, 2 and 5 years of weekly return data. Interestingly, when we focus on 1-year betas, and once the stock market data from early 2020 falls out of the measurement period, the beta value falls as sharply as it first rose in the first quarter of 2020.[8] However, the 1-year beta as of June 2023, of approximately 0.75, remains considerably greater than the beta value of approximately 0.50 at the end of 2019. Moreover, there have been some relatively significant swings in the 1-year beta estimates in the period following the exclusion of early 2020 data. The 2-year utility betas follow a similar path to the 1-year betas. Therefore, it is apparent that, as things stand, once the acutely volatile market data from early 2020 falls out of a beta’s measurement period that the value will decrease substantially. This could change once again if a significant level of market volatility were to occur again in the future.
Figure 2: S&P 500 Utility Sector Betas At Different Study Periods
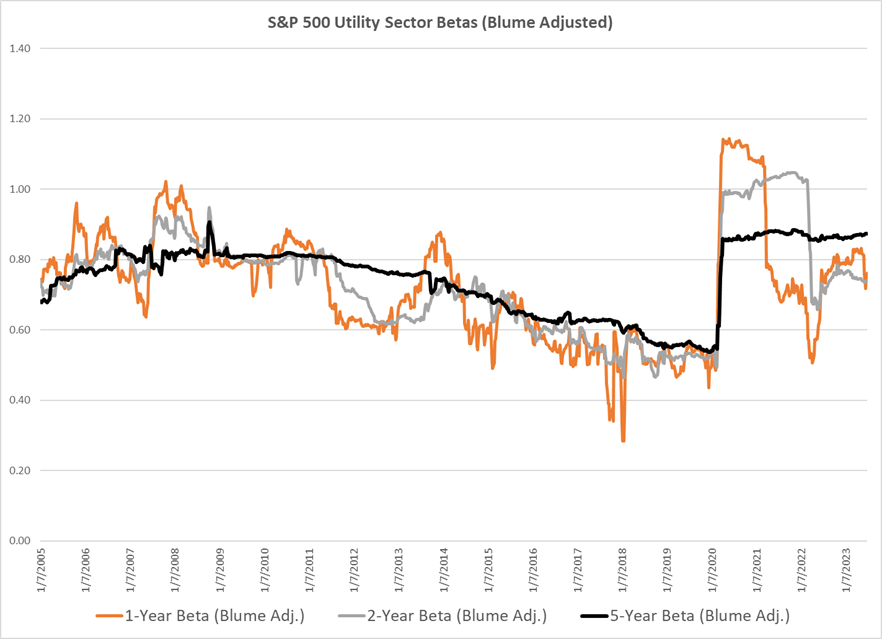
Source: market data retrieved from S&P Capital IQ
4. Behind the Utility Beta Estimates – What Components Are Driving Changes?
It is useful to examine the underlying components of the beta calculation to better understand how the overall beta estimate is determined. As detailed earlier, the key components are: (1) correlation between the individual stock and the market index; (2) the standard deviation in returns of the individual stock as a factor of the standard deviation of the market index; and (3) the Blume adjustment made to the underlying raw beta estimate. As a guide, please note that holding all else equal, if the correlation increases, the beta estimate increases; if the standard deviation factor increases, the beta estimate increases; and the farther away the raw beta is from 1.0, the larger the impact will be from the Blume adjustment to bring the beta closer to 1.0.
Figure 3 below illustrates how these components have evolved over time. We offer several observations on how these computational elements have impacted 5-year utility betas:
- In early 2020, the utility sector’s standard deviation increased at a more rapid rate than the S&P 500 Index’s standard deviation, leading to an approximate 17.5% increase in the standard deviation factor used as part of the beta calculation. The factor went from 1.03 at the end of 2019 to 1.21 by the end of April 2020. This puts considerable upward pressure on the beta result.
- Additionally, and crucially, the correlation between the utility sector and the S&P 500 Index increased dramatically with the correlation factor more than doubling in early 2020. It went from 0.30 at the end of 2019 to 0.65 by the end of April 2020.
- Of note, both of these components have been at similarly high levels in the past. However, for the most part, when these components were at these higher levels, they were not high at the same time. This highlights the uniqueness of the COVID-19 market volatility and its impact on utility betas.
- The Blume adjustment’s impact of increasing utility betas was considerably less since early 2020 given that the underlying raw beta was much closer to 1.0 than before.
Figure 3: S&P 500 Utility Sector Beta Calculation Components
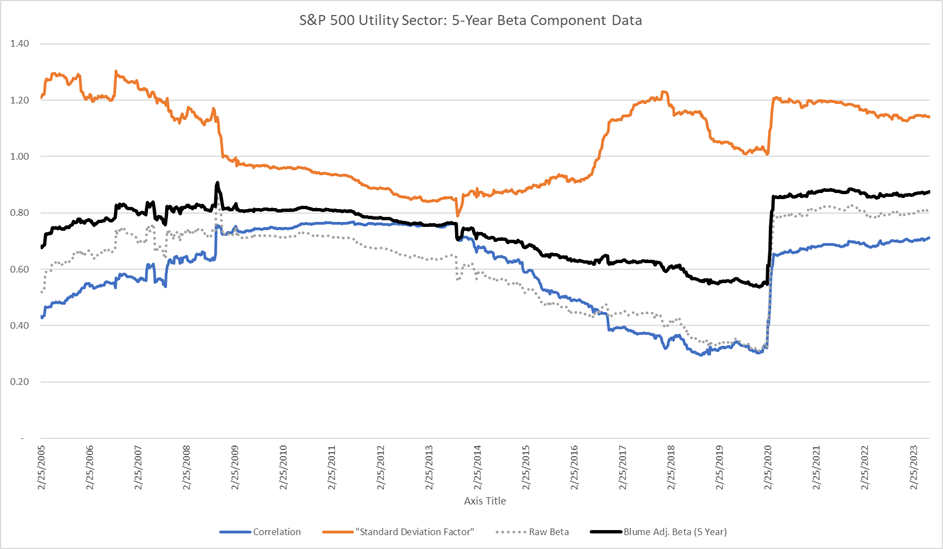
Source: market data retrieved from S&P Capital IQ
5. Considerations for Regulatory Cost of Capital Proceedings
As a result of the continued high 5-year utility betas, the following issues may gain the attention of regulators and intervenors in future proceedings:
- Should utility betas be measured using a study period of less than 5 years in order to omit the early 2020 market volatility? Generally speaking, betas calculated using shorter study periods are reasonably expected to be more volatile, is that of concern to regulators?
- Do the presently higher betas provide greater scope for regulators to accept more modest market risk premiums?[9] For example, in our view, FERC’s reliance on a DCF method that only uses short-term earnings growth rates and omits a long-term growth rate to estimate a market risk premium leads to an overstated estimate. Perhaps there will be increased focus from FERC and/or other regulators to make certain changes that would facilitate more reasonable estimates.
- Notwithstanding the theoretical grounding of the CAPM method, will regulators begin to call into question the reliability of the method for purposes of determining a fair, just and reasonable return on equity for regulated utilities?

About the Author:
Breandan Mac Mathuna leads the GDS Associates utility cost of capital practice area and provides expert witness testimony, analysis of utilities’ current cost of capital and is regularly involved in technical and settlement conferences. Mr. Mac Mathuna welcomes your inquiries regarding this article and is available to discuss your regulatory cost of capital needs.
Contact Information:
Breandan.MacMathuna@gdsassociates.com
www.linkedin.com/in/breandanmacmathuna
References:
[1] For example, see Edison Electric Institute, Stock Performance, Q3 2021 Financial Update at page 5, which states “when investor sentiment is bullish, utility growth always seems slow. When sentiment is bearish, the industry’s steady outlook and income generally offer a welcome safe harbor and utilities do (relatively) well. That did not work in early 2020 for reasons that aren’t entirely clear (even in hindsight when market moves always seem obvious), and utilities sold off hard into the pandemic along with the major averages.”
[2] An analyst must decide on the stock market index to use as the measure of the market return (e.g., S&P 500, NYSE etc.), length of historical period of realized returns (e.g., 5 years, 2 years, etc.), the interval of realized returns (e.g., monthly, weekly or daily). Additionally, an analyst must decide whether to apply what is known as the Blume adjustment, which adjusts a stock’s raw beta towards 1.0 based on the premise that the beta for all stocks trend towards 1.0.
[3] Another common approach of expressing the beta formula is Covariance (Ri, Rm) / Variance (Rm).
[4] Thus, the first 5-year beta estimate we report starts in January 2005.
[5] Mo Chaudhury, How Did the Financial Crisis Affect Daily Stock Returns, Journal of Investing, Fall 2014, at pages 66-67.
[6] See, for example, Yacine Ait-Sahalia et. al., Finance and Economics Discussion Series 2021-063. Washington: Board of Governors of the Federal Reserve System at page 26 (““The Covid-19 pandemic triggered strong market reactions. At the peak of the crisis in mid March 2020, stock market volatility exceeded the highest levels previously seen during the financial crisis and caused equity markets to rapidly lose value, and then subsequently recover…Uncertainty increased substantially in late February and remained at very elevated levels throughout most of the sample period. By contrast, volatility initially spiked sharply and then quickly reverted to levels closer to its full-sample mean…In short, around this period the market experienced a regime transition from a more connected regime characterized by extremely high uncertainty and extremely high volatility to a more disconnected regime characterized by extremely high uncertainty and moderately high (but no longer extreme) volatility.”)
[7] It bears noting, that generally speaking, betas produced using shorter study periods are expected to be more volatile than one computed using 5-years of data.
[8] Although we note the 1 year beta value doesn’t quite fall back as low as it was immediately before the initial COVID-19 market volatility of early 2020.
[9] The market risk premium is another key assumption for a CAPM analysis.